There are some deadlines that you MUST meet, and for anyone using Google Analytics, about 75 million websites or so, 1 July 2024 is the one. Before then, any website owner who does not back up their data will lose access to all Universal Analytics properties and the API (not even with read-only access). Google will permanently delete your data.
How big of a deal is this? Permanent deletion means irreversible data loss. All of your Universal Analytics (UA) historical data is gone.
The loss is more than just numbers — it’s about losing invaluable data and insights that could shape your organization’s strategic planning and informed decision-making.
Let’s explore the importance of backing up your historical data, different options, and the key metrics you should prioritize. Let’s ensure you don’t lose the information that helps drive your future business strategies.
We also built a simple (but handy) template in Looker Studio to help back up your UA data, which we linked below to help you do this.
What’s happening to Google Analytics data?
Google launched GA4 a few years ago and, along with the change, started phasing out the beloved Universal Analytics (UA).
Here is a quick timeline to recap:
- October 2020: GA4 launched
- March 2023: Google migrated UA instances to GA4 (if you didn’t migrate yourself beforehand)
- July 2023: UA properties stopped processing new data
- July 2024: Everyone loses access (and their data) in UA
Why the change, Google?
The change aims to offer more advanced analytics capabilities, including better tracking of user interactions across devices and platforms, enhanced privacy features, and improved integration with Google Ads.
Why it’s important to back up your historical data
Put simply, your future self will thank you for putting in the time and effort now. You worked hard to capture all this data — the least you can do is save it.
- Value of historical data
- Long-term Trend Analysis: Historical data provides a baseline to measure growth and understand long-term trends.
- Benchmarking: Compare current performance against past results with historical data
- Business Intelligence and Decision Making
- Regulations: Many industries require data retention for compliance.
- Continuity: Essential for those who work with different agencies, consultants, or in-house teams.
Options for backing up your historical UA data
Fortunately, several options are available to help you securely back up your historical Universal Analytics data before it’s too late. Let’s explore these methods to ensure your data remains intact and accessible.
Back It Up Manually
One straightforward method is to export your data from UA manually. You can download reports in various formats, such as CSV or PDF, and store them locally or in cloud storage (like Google Sheets). This method is simple but can be time-consuming for large datasets. However, this option is sufficient for most use cases.
- Pro: Simple and free
- Con: Time-consuming, prone to human error
Automated Solutions
Several third-party tools, such as Supermetrics, Analytics Canvas, and Analytics Safe, offer automated solutions for backing up your UA data. These tools can extract and store your data in a data warehouse or other storage solutions, streamlining the backup process.
- Pro: Simple
- Con: Cost, lack of control with pre-built solutions
Data Warehousing
Storing your data in a data warehouse like Google BigQuery allows for more extensive data analysis and easier access to historical data. This method is ideal for businesses with large amounts of data or requiring complex queries.
- Pro: More complex to set up
- Con: Ongoing cost to host and manage the data
Custom Scripts and APIs
For those with technical expertise, using the Google Analytics Reporting API can efficiently back up your data. Custom scripts can automate extraction, ensuring you capture all relevant data points.
- Pro: More complex to set up
- Con: If your developer disappears, what do you do?
Now that you’ve seen the various methods for securing your historical data, it’s time to dive into the specifics of what you should be backing up. Ensuring you capture the right metrics is critical to preserving the valuable insights that will guide your future strategies.
You might be thinking, “Is there an easier way?” If you’d prefer to leave it to the pros, we’ve got you covered.
What metrics should I backup?
Below are the key reports we recommend backing up based on our experience at Farinella LLC. These focus on the most commonly accessed data, but remember, each business and use case is unique. Tailor this guide to fit your specific needs to ensure you capture your organization’s most relevant and valuable insights.
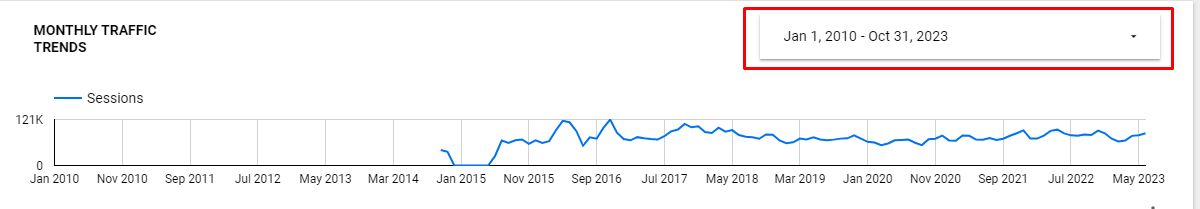
Traffic Trends:
Why it’s important
Tracking traffic trends over time allows you to understand your website’s growth, seasonal variations, and user behavior changes. This data is crucial for identifying long-term patterns and making informed decisions about future strategies.
- Dimensions: Month of year
- Metrics: Sessions, Users, Bounce rate, Pages/Session, Average session duration, Goal completions, Goal conversion rate, Transactions, Revenue
Traffic Sources
Why it’s important
Knowing where your traffic originates helps you assess the effectiveness of different marketing channels and campaigns. This insight is essential for optimizing your marketing spend and improving your acquisition strategies.
- Dimensions: Source/medium, campaign properties, Month of year
- Metrics: Sessions, Users, Bounce rate, Pages/Session, Average session duration, Goal completions, Goal conversion rate, Transactions, Revenue.
Landing Page Performance
Why it’s important
Identifying which landing pages resonate with users can help optimize content and improve conversion rates. This data reveals which pages drive engagement and conversions.
- Dimensions: Landing page
- Metrics: Sessions, Users, Bounce rate, Pages/Session, Average session duration, Goal completions, Goal conversion rate, Transactions, Revenue
Device Performance
Why it’s important
Understanding how different devices perform on your site helps optimize user experiences across platforms. This is critical for ensuring accessibility and improving overall user satisfaction.
- Dimensions: Device category
- Metrics: Sessions, Users, Bounce rate, Pages/Session, Average session duration, Goal completions, Goal conversion rate, Transactions, Revenue
Events
Why it’s important
Event tracking provides insights into user interactions not captured by standard page views or sessions. This is valuable for understanding how users engage with specific elements on your site.
- Dimensions: Event category, event action, event label
- Metrics: Sessions with events, Total events, Unique events, Event value
Conversions
Why it’s important
Conversion tracking is essential for measuring the success of your goals and e-commerce activities. This data helps you understand which actions lead to business outcomes and informs future marketing strategies.
- Dimensions: Month of year, goal completion location
- Metrics: Goal completions (1 to 20, depending on setup).
Geographic Data
Why it’s important
Knowing where your traffic comes from geographically helps you tailor your marketing strategies to specific regions. This data is crucial for effectively targeting and localizing your campaigns.
- Dimensions: Month of year, country, region, city
- Metrics: Sessions, Users, Bounce rate, Pages/Session, Average session duration, Goal completions, Goal conversion rate, Transactions, Revenue
Demographic Data
Why it’s important
Demographic data provides insights into your audience’s age and gender, helping you tailor content and marketing strategies to your key customer segments.
- Dimensions: Month of year, gender, age
- Metrics: Sessions, Users, Bounce rate, Pages/Session, Average session duration, Goal completions, Goal conversion rate, Transactions
In-market Segments
Why it’s important
Understanding what your audience is in the market for can help refine your advertising and content strategies. This data is valuable for targeting users with relevant products or services.
- Dimensions: In-market segment
- Metrics: Sessions, Users, Bounce rate, Pages/Session, Average session duration, Goal completions, Goal conversion rate, Transactions, Revenue
Internal Site Search
Why it’s important
Internal site search data reveals what users seek on your site, providing insights into user intent and content gaps. This information is valuable for improving site navigation and content strategy.
- Dimensions: Search term
- Metrics: Sessions with search, Average session duration, Goal conversion rate, Goal completions, Transactions, Revenue
Why it’s important to back these specific metrics up
Backing up these metrics isn’t just a precaution; it’s a strategic move. By preserving this data, you’ll maintain a clear historical context that covers most of your analytical needs.
You’ll gain insights into overall trends, understand where your traffic came from over time, and get a detailed picture of who your audience was. This empowers you to make informed decisions, plan future strategies, and drive growth confidently.
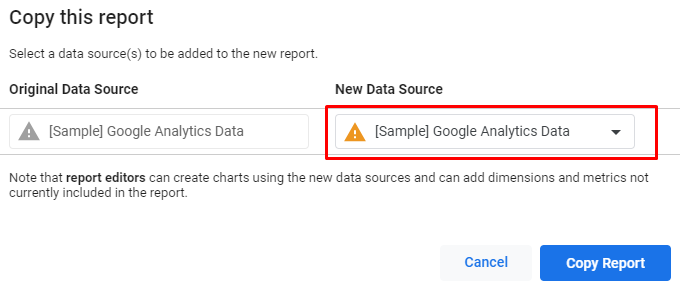
Looker Studio template for backing up UA data
We built a simple but time-saving Looker Studio template to simplify this process. Again, there are a wide variety of options for businesses to backup their Universal Analytics data, but this template will ensure you capture what’s absolutely crucial.
This template makes running the reports simple (just connect your data source). But, you will need to export each table to either Excel or Google Sheets to store the data. After July 1, 2024, Looker Studio will lose access to your UA account.
Note: We included a few filters across these reports to avoid overwhelming Data Studio and keep your Google Sheets manageable during backup. For example, on Historical Pageview Data, we filter out pages with fewer than ten page views in any given month. Depending on your website’s data, you may want to edit these filters.
Step-by-step guide to backing up your UA data with our template
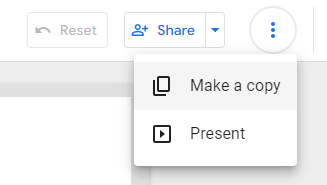
- Step 2: Connect your UA property
- Step 3: Update the date range based on when your UA data starts
- Step 4: Make sure each table is connected to your data source instead of the sample data, and check the filters on each table to update based on your needs.
- Step 5: Export each table from all pages to a CSV or Google Sheets
- Step 6: We suggest creating one single Google sheet and multiple tabs for each report – be sure to note the filters you applied for future reference in your sheet.
Now, pat yourself on the back! You’ve just safeguarded years of invaluable data. Your future self (and your business) will thank you. High five! 🖐️
Want experts to do it?
Contact Farinella to get the team to do this all for you.
Contact us today for help.